Descriptions of W3C Diversity bar charts
This is the long description of the graphs in the 2024 report representing gender and geography of several of W3C's governance bodies: W3C Advisory Board (AB), W3C Technical Architecture Group (TAG), W3C Board of Directors (BoD), and W3C Management (W3M).
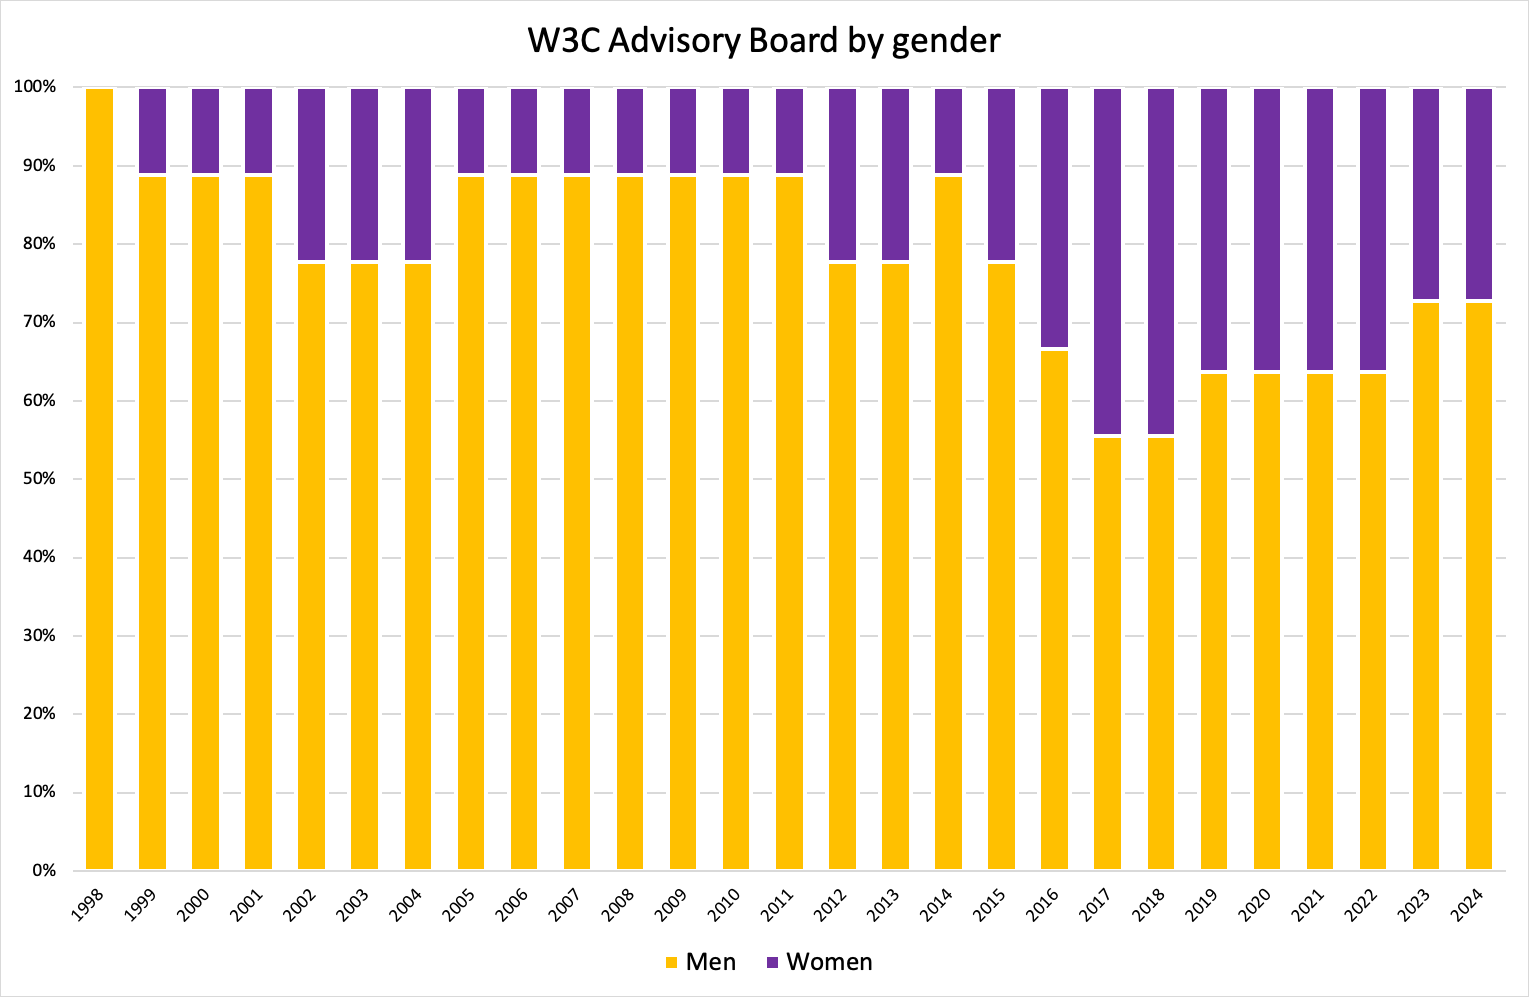
Description of the bar chart: AB by gender

|
Men |
Women |
| 1998 |
9 |
0 |
| 1999 |
8 |
1 |
| 2000 |
8 |
1 |
| 2001 |
8 |
1 |
| 2002 |
7 |
2 |
| 2003 |
7 |
2 |
| 2004 |
7 |
2 |
| 2005 |
8 |
1 |
| 2006 |
8 |
1 |
| 2007 |
8 |
1 |
| 2008 |
8 |
1 |
| 2009 |
8 |
1 |
| 2010 |
8 |
1 |
| 2011 |
8 |
1 |
| 2012 |
7 |
2 |
| 2013 |
7 |
2 |
| 2014 |
8 |
1 |
| 2015 |
7 |
2 |
| 2016 |
6 |
3 |
| 2017 |
5 |
4 |
| 2018 |
5 |
4 |
| 2019 |
7 |
4 |
| 2020 |
7 |
4 |
| 2021 |
7 |
4 |
| 2022 |
7 |
4 |
| 2023 |
8 |
3 |
| 2024 |
8 |
3 |
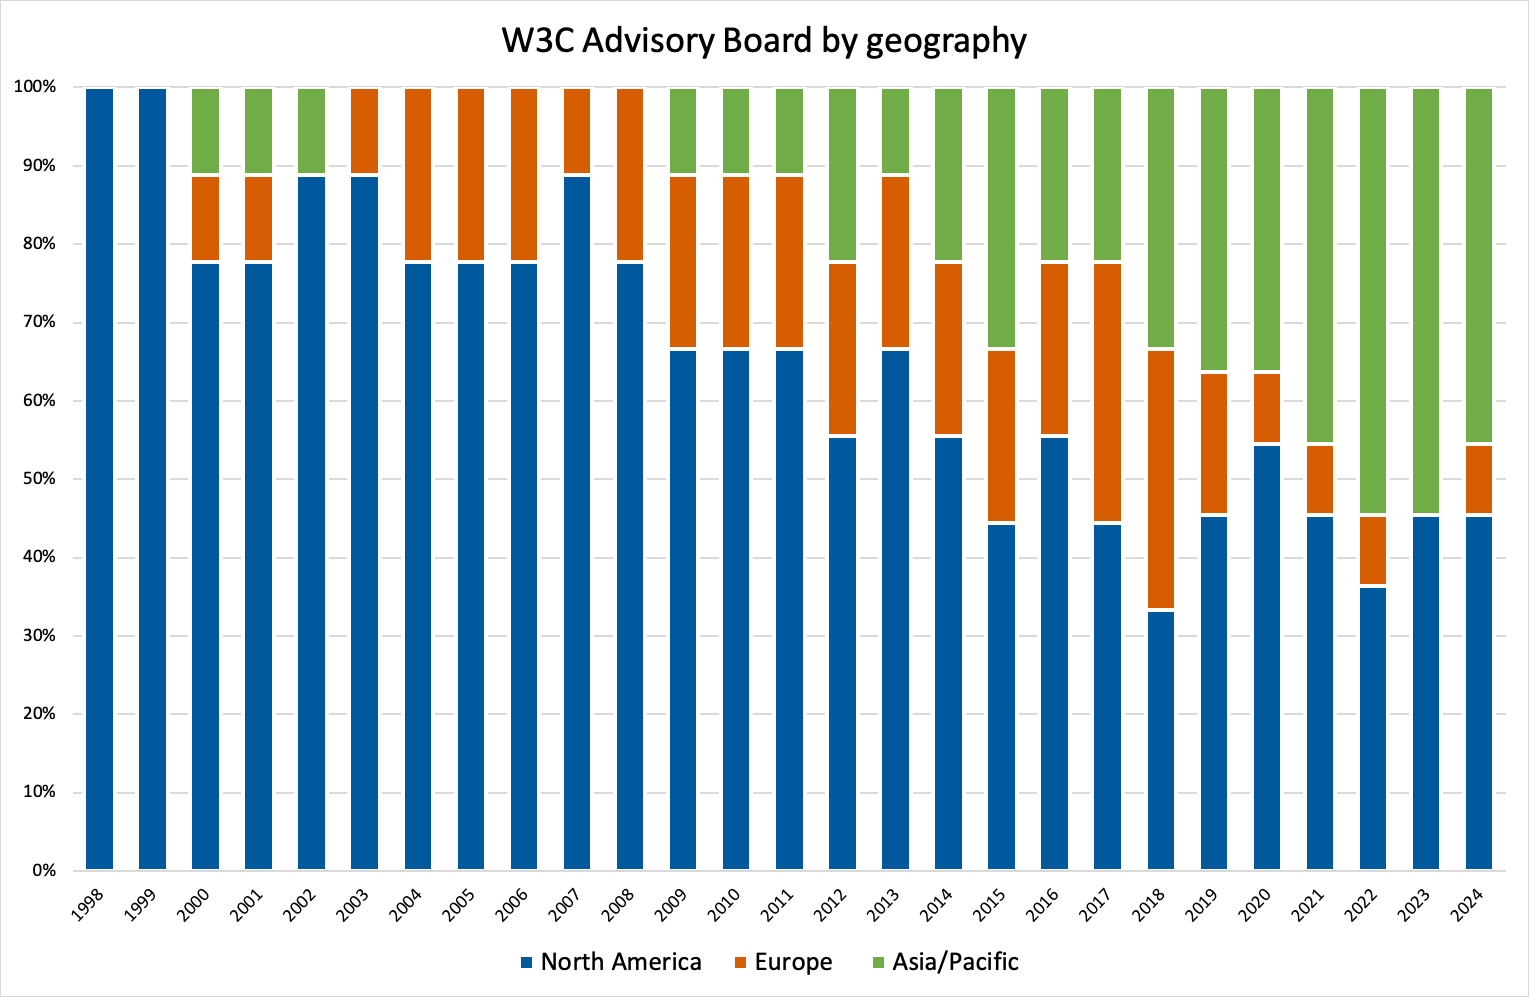
Description of the bar chart: AB by geography

|
North America |
Europe |
Asia/Pacific |
| 1998 |
9 |
0 |
0 |
| 1999 |
9 |
0 |
0 |
| 2000 |
7 |
1 |
1 |
| 2001 |
7 |
1 |
1 |
| 2002 |
8 |
0 |
1 |
| 2003 |
8 |
1 |
0 |
| 2004 |
7 |
2 |
0 |
| 2005 |
7 |
2 |
0 |
| 2006 |
7 |
2 |
0 |
| 2007 |
8 |
1 |
0 |
| 2008 |
7 |
2 |
0 |
| 2009 |
6 |
2 |
1 |
| 2010 |
6 |
2 |
1 |
| 2011 |
6 |
2 |
1 |
| 2012 |
5 |
2 |
2 |
| 2013 |
6 |
2 |
1 |
| 2014 |
5 |
2 |
2 |
| 2015 |
4 |
2 |
3 |
| 2016 |
5 |
2 |
2 |
| 2017 |
4 |
3 |
2 |
| 2018 |
3 |
3 |
3 |
| 2019 |
5 |
2 |
4 |
| 2020 |
6 |
1 |
4 |
| 2021 |
5 |
1 |
5 |
| 2022 |
4 |
1 |
6 |
| 2023 |
5 |
0 |
6 |
| 2024 |
5 |
1 |
5 |
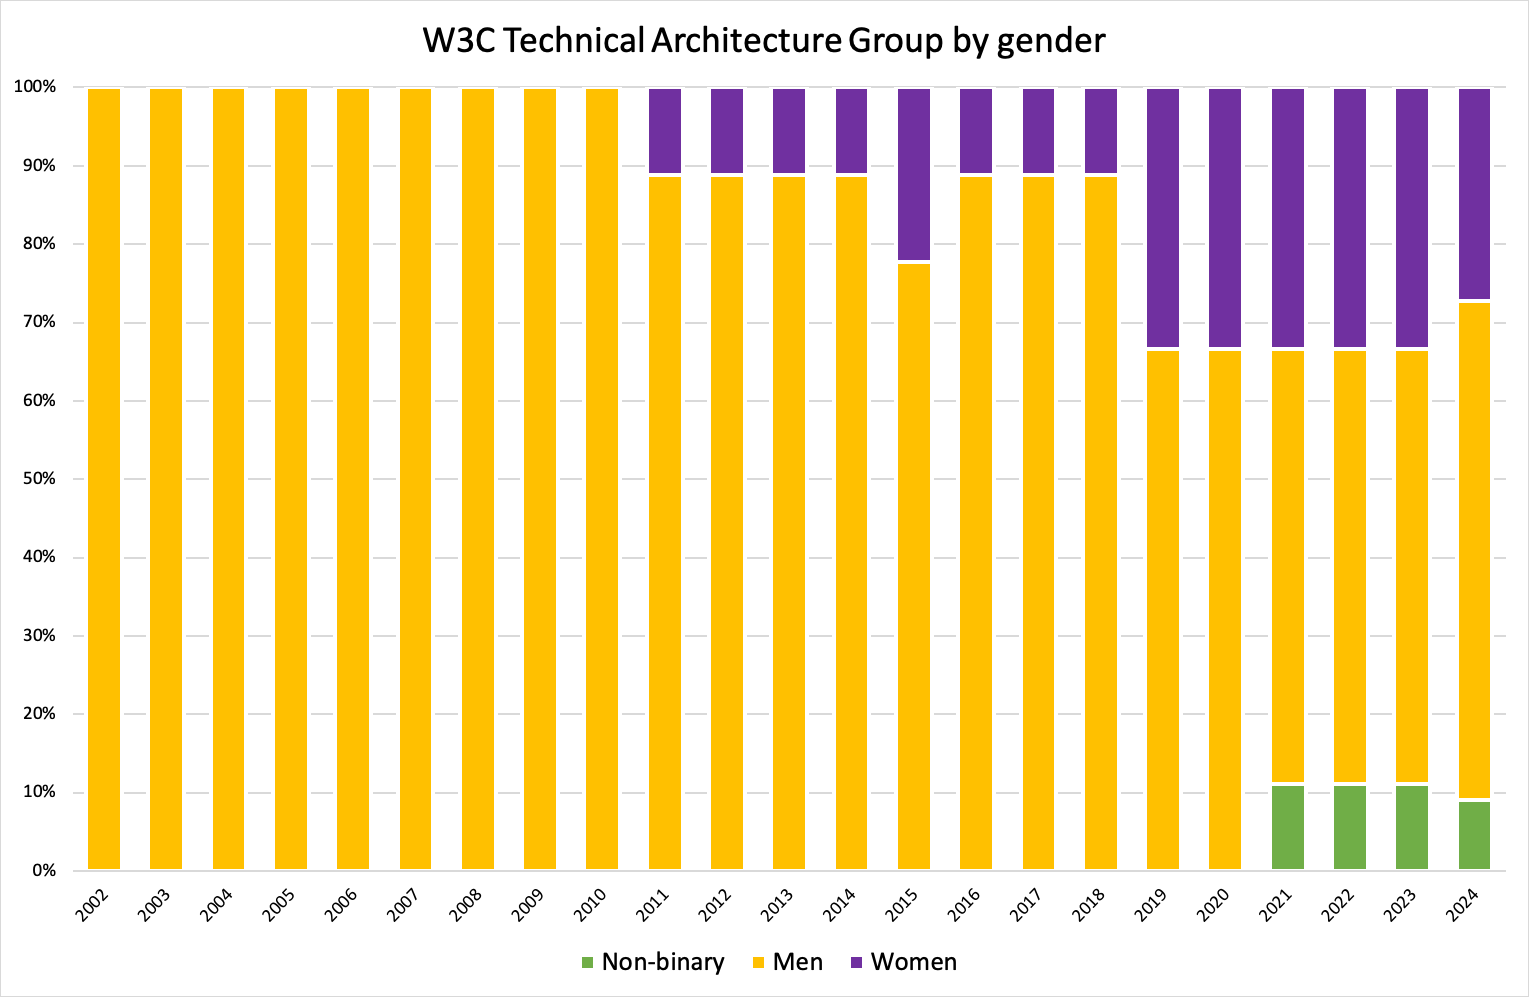
Description of the bar chart: TAG by gender

|
Non-binary |
Men |
Women |
| 2002 |
|
9 |
0 |
| 2003 |
|
9 |
0 |
| 2004 |
|
9 |
0 |
| 2005 |
|
9 |
0 |
| 2006 |
|
9 |
0 |
| 2007 |
|
9 |
0 |
| 2008 |
|
9 |
0 |
| 2009 |
|
9 |
0 |
| 2010 |
|
9 |
0 |
| 2011 |
|
8 |
1 |
| 2012 |
|
8 |
1 |
| 2013 |
|
8 |
1 |
| 2014 |
|
8 |
1 |
| 2015 |
|
7 |
2 |
| 2016 |
|
8 |
1 |
| 2017 |
|
8 |
1 |
| 2018 |
|
8 |
1 |
| 2019 |
|
6 |
3 |
| 2020 |
|
6 |
3 |
| 2021 |
1 |
5 |
3 |
| 2022 |
1 |
5 |
3 |
| 2023 |
1 |
5 |
3 |
| 2024 |
1 |
7 |
3 |
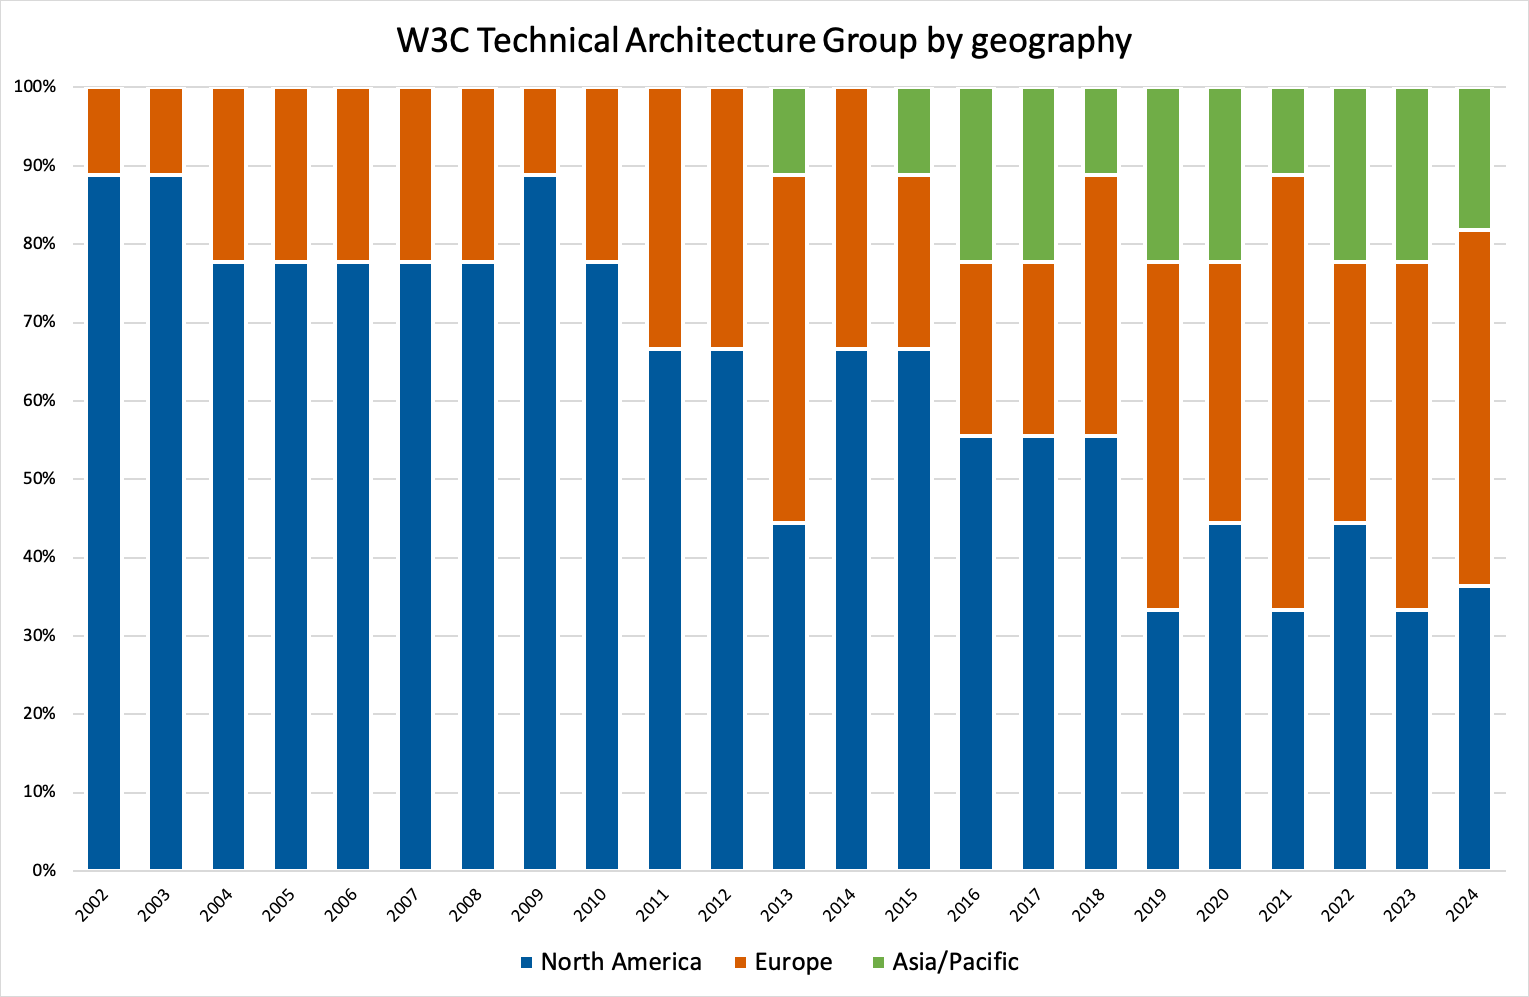
Description of the bar chart: TAG by geography

|
North America |
Europe |
Asia/Pacific |
| 2002 |
8 |
1 |
0 |
| 2003 |
8 |
1 |
0 |
| 2004 |
7 |
2 |
0 |
| 2005 |
7 |
2 |
0 |
| 2006 |
7 |
2 |
0 |
| 2007 |
7 |
2 |
0 |
| 2008 |
7 |
2 |
0 |
| 2009 |
8 |
1 |
0 |
| 2010 |
7 |
2 |
0 |
| 2011 |
6 |
3 |
0 |
| 2012 |
6 |
3 |
0 |
| 2013 |
4 |
4 |
1 |
| 2014 |
6 |
3 |
0 |
| 2015 |
6 |
2 |
1 |
| 2016 |
5 |
2 |
2 |
| 2017 |
5 |
2 |
2 |
| 2018 |
5 |
3 |
1 |
| 2019 |
4 |
4 |
1 |
| 2020 |
4 |
3 |
2 |
| 2021 |
3 |
5 |
1 |
| 2022 |
4 |
3 |
2 |
| 2023 |
3 |
4 |
2 |
| 2024 |
4 |
5 |
2 |
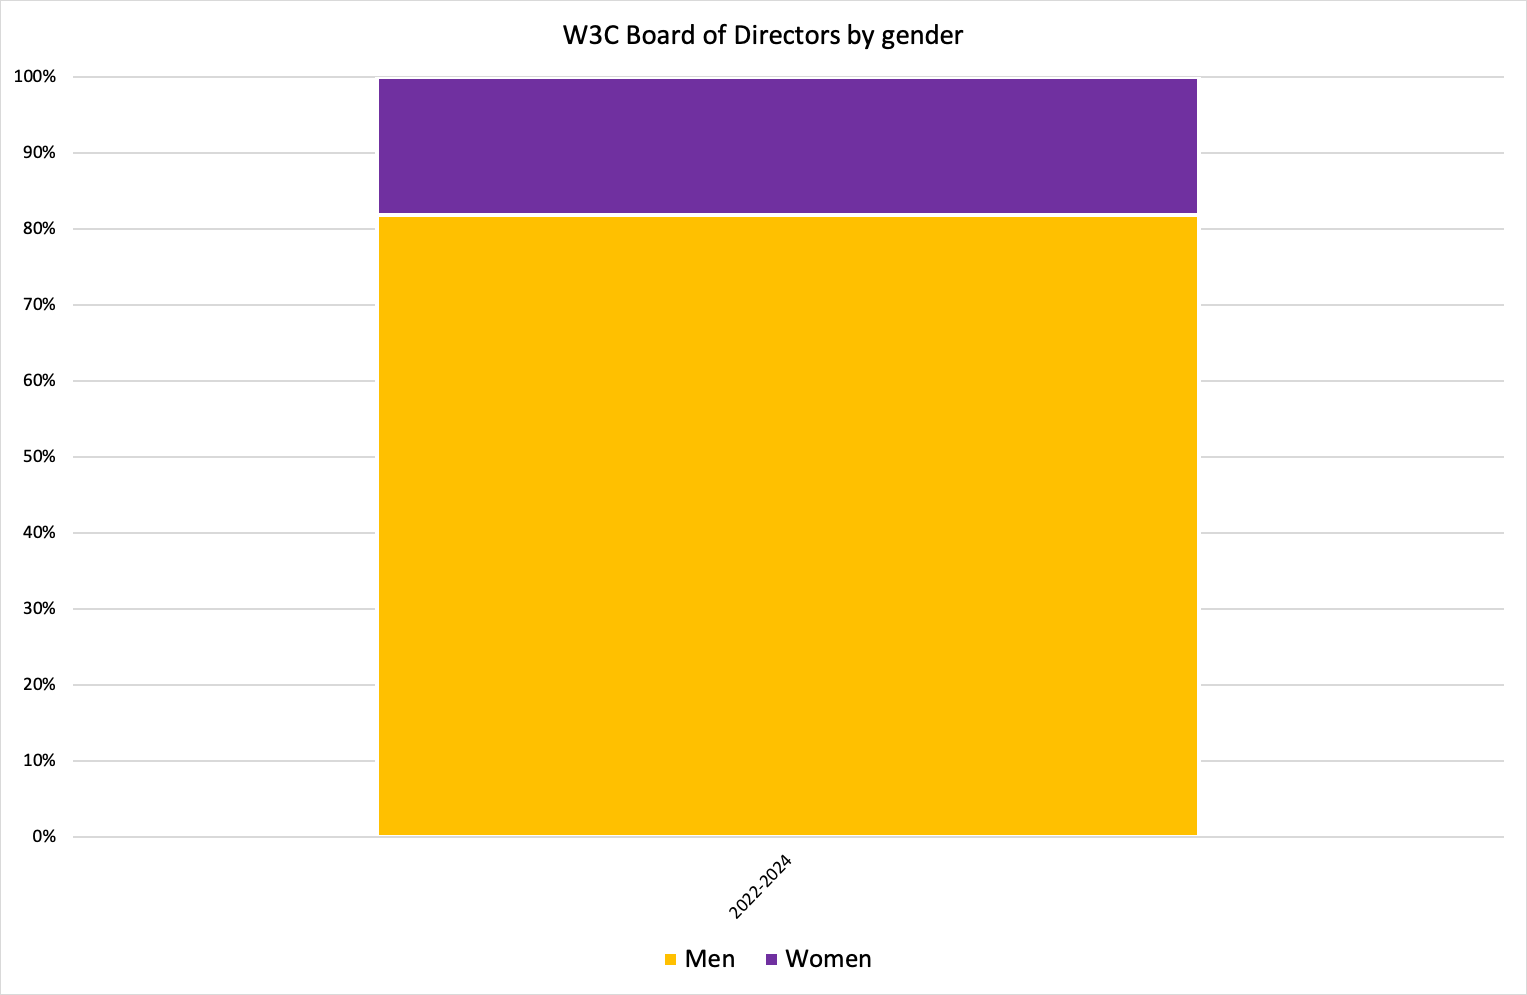
Description of the bar chart: BoD by gender

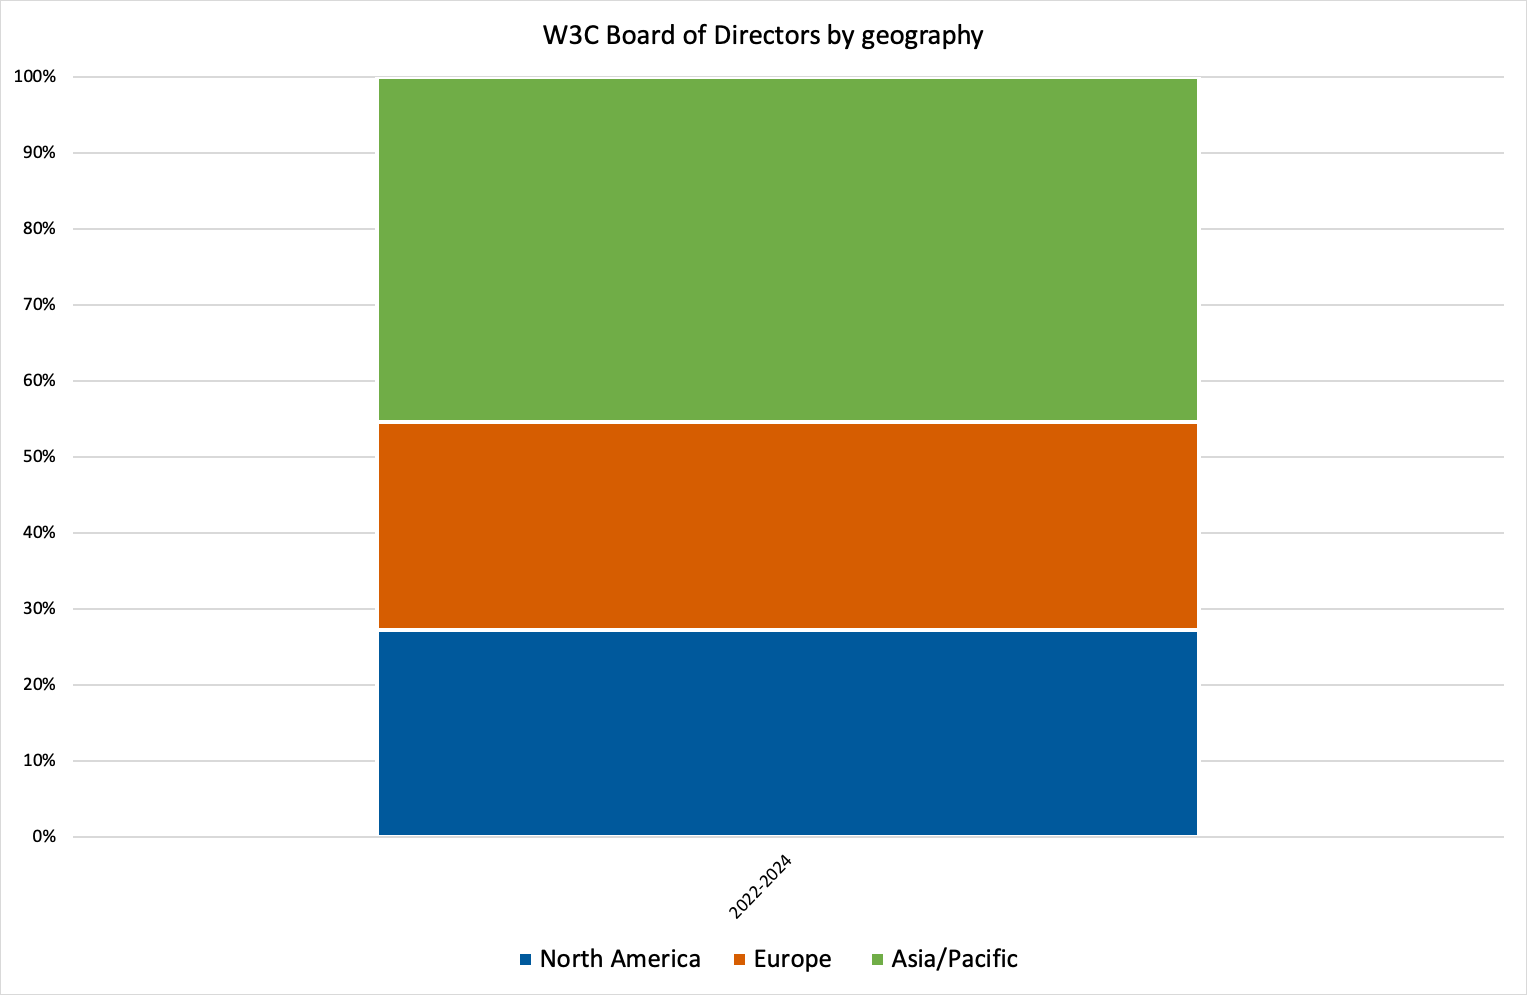
Description of the bar chart: BoD by geography

|
North-America |
Europe |
Asia/Pacific |
| 2022-2024 |
3 |
3 |
5 |
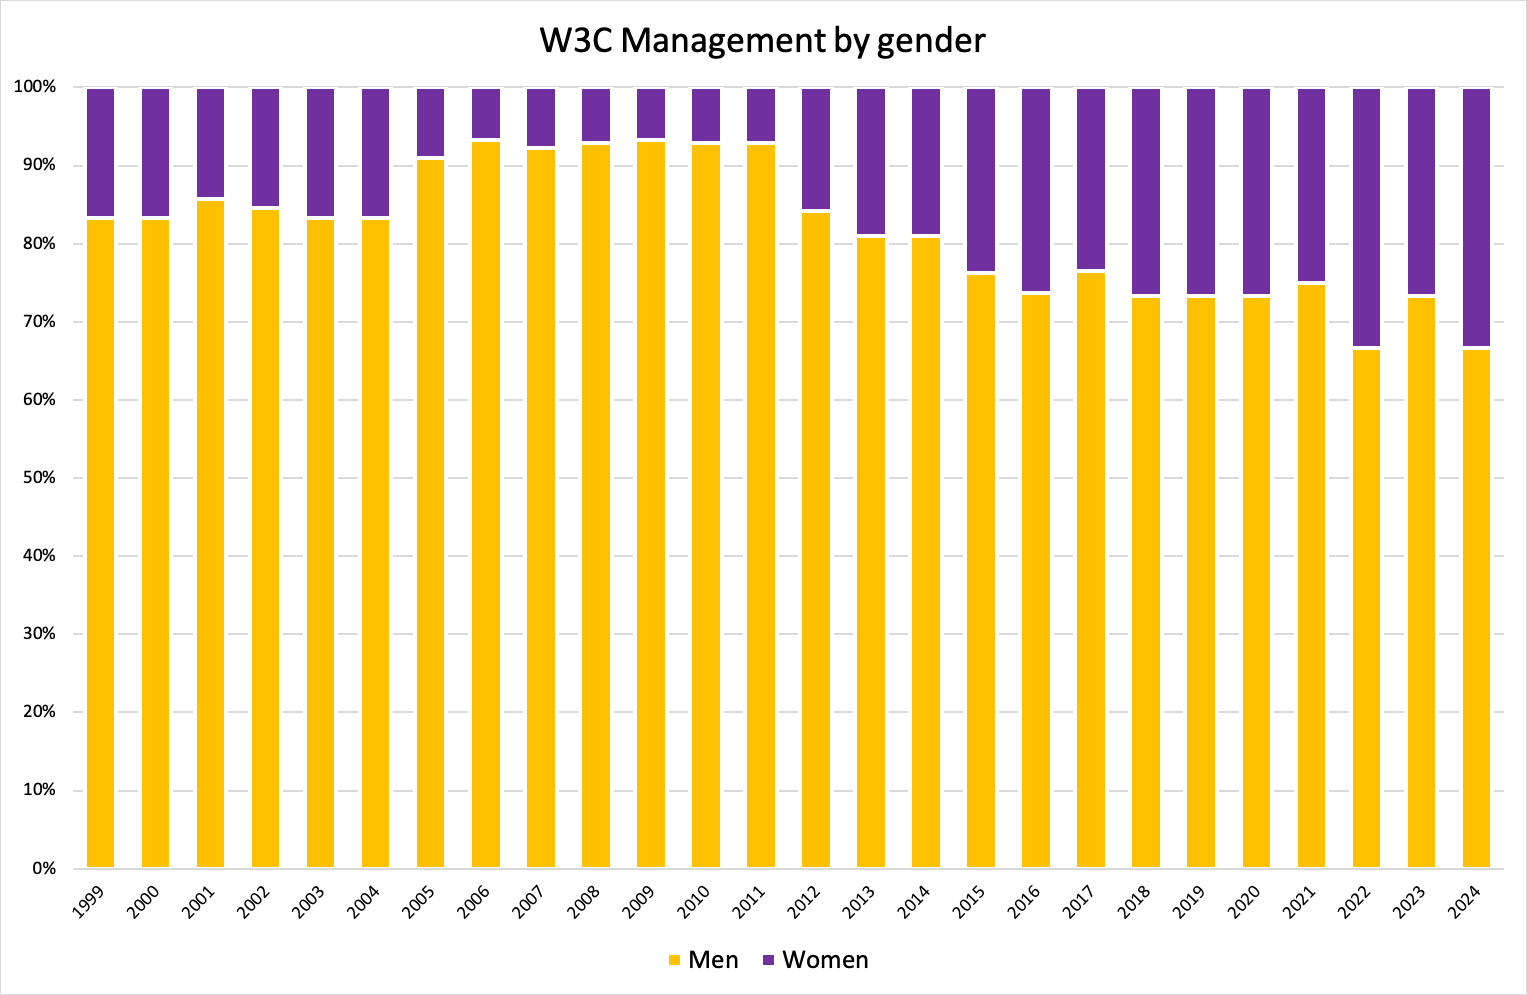
Description of the bar chart: W3M by gender in
percentages

|
Men |
Women |
| 1999 |
83 |
17 |
| 2000 |
83 |
17 |
| 2001 |
86 |
14 |
| 2002 |
85 |
15 |
| 2003 |
83 |
17 |
| 2004 |
83 |
17 |
| 2005 |
91 |
9 |
| 2006 |
93 |
7 |
| 2007 |
92 |
8 |
| 2008 |
93 |
7 |
| 2009 |
93 |
7 |
| 2010 |
93 |
7 |
| 2011 |
93 |
7 |
| 2012 |
84 |
16 |
| 2013 |
81 |
19 |
| 2014 |
81 |
19 |
| 2015 |
76 |
24 |
| 2016 |
74 |
26 |
| 2017 |
76 |
24 |
| 2018 |
73 |
27 |
| 2019 |
73 |
27 |
| 2020 |
73 |
27 |
| 2021 |
75 |
25 |
| 2022 |
66 |
34 |
| 2023 |
73 |
27 |
| 2024 |
67 |
33 |
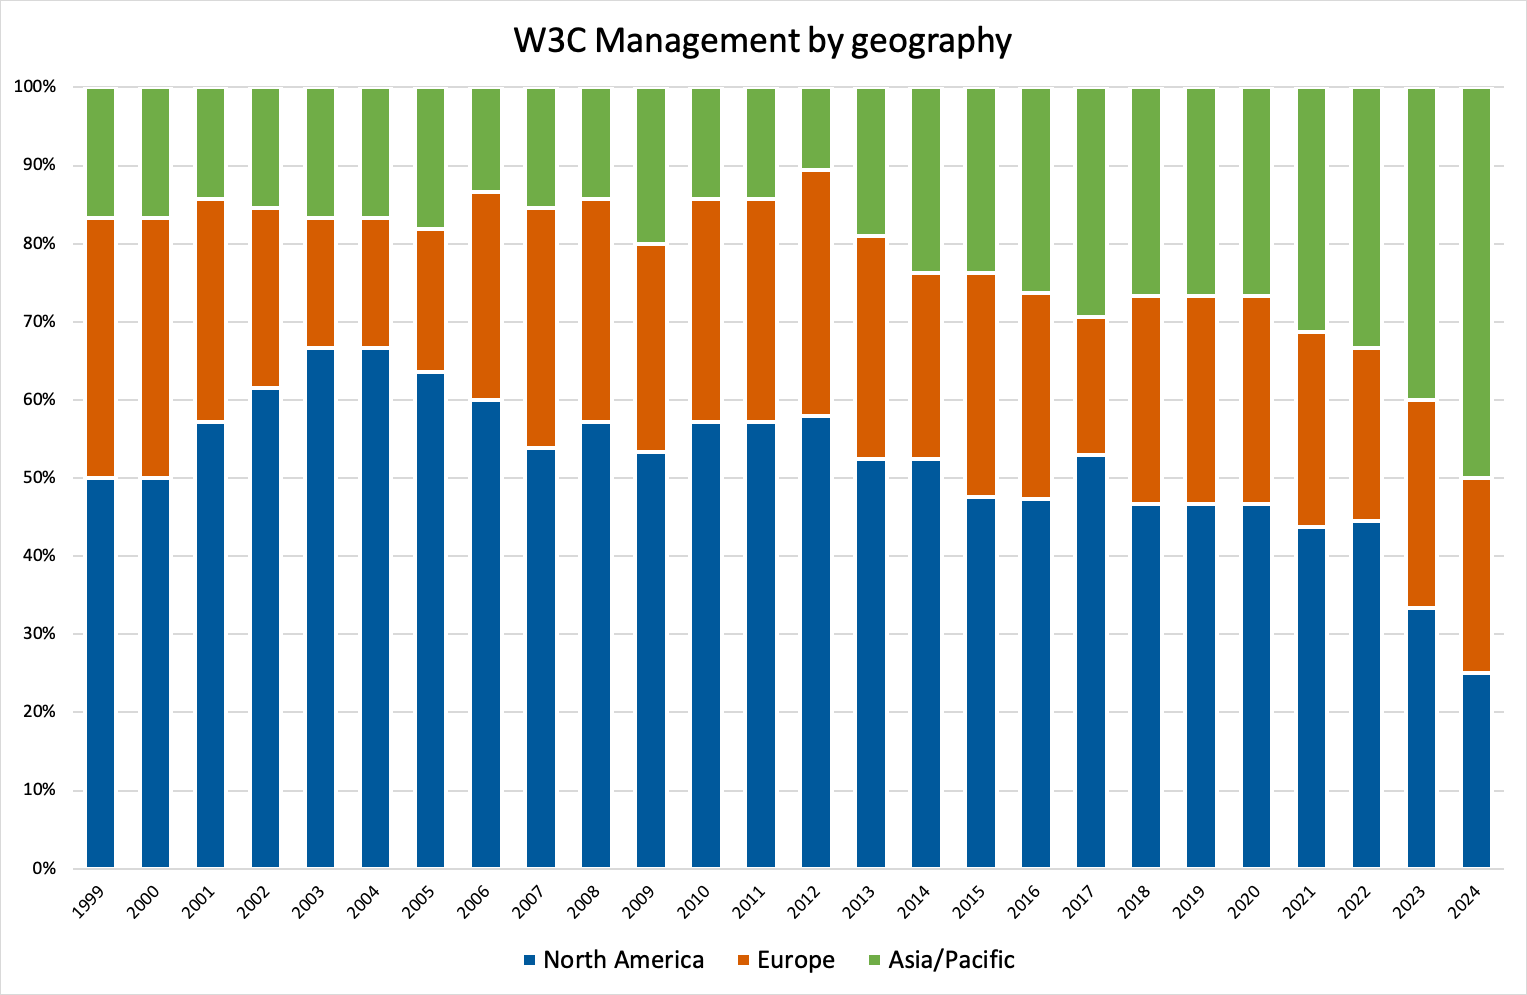
Description of the bar chart: W3M by geography in
percentages

|
North America |
Europe |
Asia/Pacific |
| 1999 |
50 |
32 |
18 |
| 2000 |
50 |
32 |
18 |
| 2001 |
58 |
26 |
16 |
| 2002 |
62 |
20 |
18 |
| 2003 |
66 |
16 |
18 |
| 2004 |
66 |
16 |
18 |
| 2005 |
64 |
18 |
18 |
| 2006 |
60 |
26 |
14 |
| 2007 |
54 |
30 |
16 |
| 2008 |
56 |
28 |
16 |
| 2009 |
54 |
26 |
20 |
| 2010 |
56 |
30 |
14 |
| 2011 |
56 |
30 |
14 |
| 2012 |
56 |
34 |
10 |
| 2013 |
52 |
28 |
20 |
| 2014 |
52 |
26 |
24 |
| 2015 |
48 |
28 |
24 |
| 2016 |
48 |
26 |
26 |
| 2017 |
52 |
18 |
30 |
| 2018 |
46 |
27 |
27 |
| 2019 |
46 |
27 |
27 |
| 2020 |
46 |
27 |
27 |
| 2021 |
44 |
25 |
31 |
| 2022 |
44 |
23 |
33 |
| 2023 |
33 |
27 |
40 |
| 2024 |
25 |
25 |
50 |
16 July 2024 - Coralie Mercier, Editor, W3C Marketing & Communications
Last updated:
$Id: descriptions.html,v 1.2 2024/07/17 09:51:06 coralie Exp $